In this hands-on aviation geography lesson, students will explore aviation sectional charts to learn how pilots plan cross-country flights. They will use the sectional legend to identify symbols, measure distances between airports, and select visual checkpoints (like rivers, roads, or towers). Students will also consider and account for environmental factors such as crosswinds, magnetic variation, and magnetic deviation.

Learning Targets & Objectives
In the completion of this lesson, students should be able to:
- Read an aviation sectional chart and legend.
- Identify landmarks and symbols used in aviation.
- Measure distances between two points on a map while calculating time enroute and fuel consumed.
- Use a specialized aviation calculator (E6B) to calculate the effects of crosswinds on flight headings and groundspeeds.
Student Baseline Knowledge & Skills
Students should:
- Be able to read a basic map or use a map key/legend.
- Have basic measurement and multiplication/division skills.
- Have familiarity with using a computer or tablet.
- Be comfortable working in pairs or small groups.

Formative Assessment
- Students will complete DreamFlight's advanced "Flight Navigation Log" worksheet, which includes mapping a start and end point/airport for each leg of flight, identifying 3-4 visual checkpoints per leg (rivers, towers, highways, etc.), and calculating estimated distances between checkpoints in addition to calculations to account for wind, magnetic variation, and magnetic deviation.
- Teacher observation during group or partner work.

Materials & Resources
Lesson Procedure
- Introduction & Hook (5-10 Minutes)
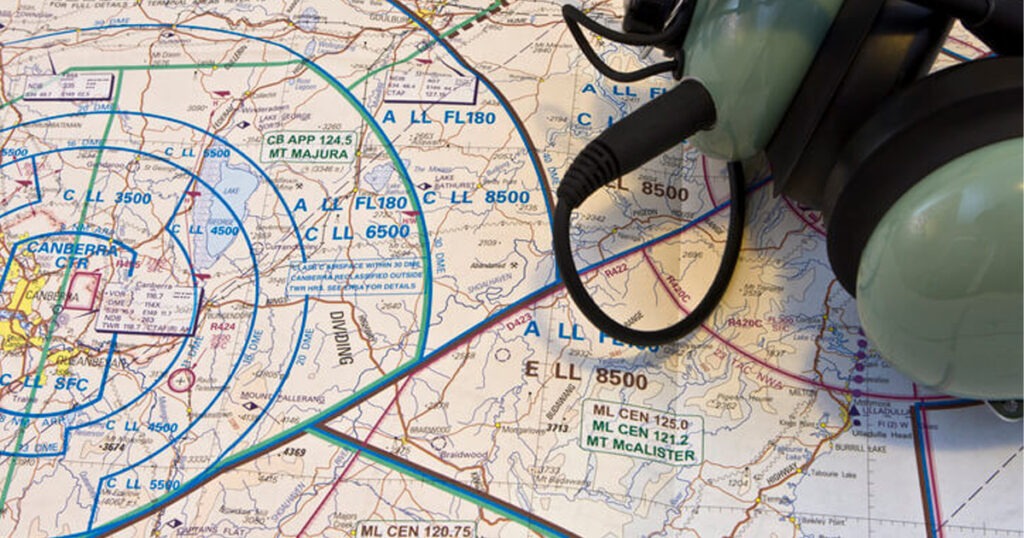
- Show a sectional chart and ask:
- “What do you think pilots use this for?”
- “How do they find their way across the sky without a road?”
- Say something similar to the following: “Pilots use sectional charts to map out visual cues that help them determine that they are still on the correct course – a navigational skill called pilotage. At the same time, they use calculations to determine their speed, time en route, and total fuel burned to validate the visual checkpoints they’ve chosen – this is called dead reckoning.”
- Introduce the challenge: “Today, you are all flight planners! You’ll chart a 3-leg route, choose visual checkpoints, and calculate the effects of wind and other factors on your aircraft’s performance.”
- Show a sectional chart and ask:
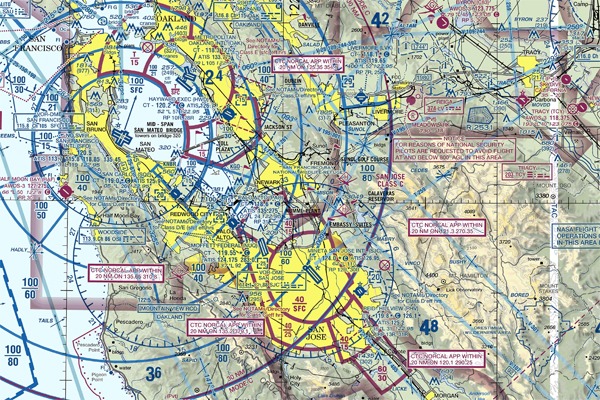
- Mini-Lesson: How to Read a Sectional Chart (10-15 Minutes)
- Review key sectional legend symbols: airports, towers, roads, rivers, and VFR waypoints.
- Demonstrate how to find a landmark using the chart.
- Show how to use a sectional ruler to measure distance (nautical miles).
- Group Flight Planning Activity (25-30 Minutes)
- Students may work in pairs or small groups.
- Each group will plot a 3-leg route from Capital City Airport > Cynthiana Harrison County Airport > Samuels Field (Bardstown) > Capital City Airport.
- Using the chart:
- Plot the route and draw course lines.
- Identify 2-3 visual checkpoints per leg (using legend/symbols).
- Measure the distances between each checkpoint.
- Record everything on the “Flight Navigation Log” worksheet.
- Determine Flight Heading (5-10 Minutes)
- Students will use a protractor to determine the flight heading for each leg of the flight.
- Place the protractor on the sectional chart, angling it to match the desired leg of the flight.
- Holding the angle, slide the protractor to the nearest line of longitude, using the same line to determine the course heading.
- Record headings for each respective leg of the flight on the worksheet.
- Students will use a protractor to determine the flight heading for each leg of the flight.
- Wind & Airspeed (5 Minutes)
- Provide students with the following information: “For your flight, your weather report says that winds will be coming in at 330° at a speed of 6 knots. Your true airspeed (based on temperature and other factors) will be 110 knots.”
- Have students log this information on the worksheet.
- Wind Correction Angles (5-10 Minutes)
- Have students visit the online E6B Calculator, inputting the course heading and provided wind direction/speeds to determine the wind correction angle, true course heading (TC), and groundspeed for each leg.
- Have students visit the online E6B Calculator, inputting the course heading and provided wind direction/speeds to determine the wind correction angle, true course heading (TC), and groundspeed for each leg.
- Magnetic Variation
- Inform students of the following: “Now we need to account for magnetic variation. Magnetic variation is the difference between true north and magnetic north. True north refers to a fixed geographic location at the North Pole, the point on Earth’s axis of rotation. Magnetic north, to which the compass in our aircraft is aligned, is constantly shifting and is not aligned with true north. On our sectional chart, there are isogonic lines that connect points on Earth with a similar angle between true north and magnetic north.”
- Have students identify and determine the closest isogonic line on the sectional chart (these are dashed, magenta lines with a deflection measured in degrees).
- Continue: “To determine how this affects our heading, we should remember the saying, ‘East is least, West is best.’ So, for magnetic variation to the west, we need to add the listed number of degrees to our heading. For easterly variations, we subtract.”
- Have students fill in the magnetic variation provided on their worksheet and adjust the heading to determine the true heading (TH).
- Magnetic Deviation (5-10 Minutes)
- Now, tell the students: “It’s also important to understand that there are various things in our aircraft that affect the compass. Our instruments and radios, for example, can alter the magnetic field near the compass – something we call magnetic deviation. Thankfully, there is a correction card that tells us how many degrees we may need to adjust our heading to account for magnetic interference on a given heading.”
- Have students find the closest chart that matches the headings for the various legs of the flight, calculating the difference and documenting it on their worksheet while calculating the final, corrected heading (CH).
- Time, Distance, and Fuel Burned
- Have students use the time, distance, and speed formula to calculate the time flown between each checkpoint of the flight.
- Then, inform students that the airplane burns about 7.5 gallons per hour and have them calculate the fuel burn for each section of the flight.
- Finally, have students tally the total distance, time, and fuel burn for the cross-country flight.
- Optional Extensions
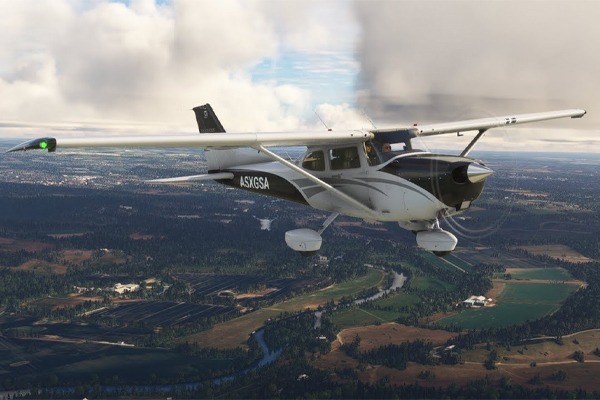
- Have students complete a leg of their planned course on Google Earth’s Flight Simulator (requires computer application access), or on one of DreamFlight’s mobile flight simulators alongside an introductory ground school lesson detailing aircraft controls.
Looking to take this experience to the next level? Learn more about DreamFlight Charities’ AVCamp program, which looks to bring the wonders of flight to even the most remote parts of the state!